A key element of a trustworthy model is that it can give an estimate of its confidence in a given prediction. We've already talked about one way to do this for linear models, and today we'll talk about a technique for getting uncertainty estimates for any model.
Let's continue using the fish dataset from last time:
import os
import pandas as pd

fish = pd.read_csv(os.path.expanduser("~/Downloads/Fish.csv"))
We build a ColumnTransformer for convenience:
from sklearn.compose import ColumnTransformer
from sklearn.preprocessing import StandardScaler, OneHotEncoder

ct = ColumnTransformer(
    [
        ("scale", StandardScaler(), ["Length1", "Length2", "Length3", "Height", "Width"]),
        ("ohe", OneHotEncoder(), ["Species"]),
    ]
)
Next we construct a pipeline which uses the ColumnTransformer from above as
well as scikit-learn's implementation of bagging. Specifically, our
BaggingRegressor will consist of 100 ElasticNet models, each one trained on a
random 25% of the dataset (with replacement).
from sklearn.ensemble import BaggingRegressor
import sklearn.linear_model as lm

pipe = make_pipeline(
    ct, BaggingRegressor(lm.ElasticNetCV(), n_estimators=100, max_samples=0.25, random_state=42, n_jobs=-1,)
)

pipe.fit(fish, fish["Weight"])
Finally, we can snag those 100 models and make a prediction for a new fish:
from sklearn.ensemble import BaggingRegressor
import sklearn.linear_model as lm
pipe = make_pipeline(
ct, BaggingRegressor(lm.ElasticNetCV(), n_estimators=100, max_samples=0.25, random_state=42, n_jobs=-1,)
)
pipe.fit(fish, fish["Weight"])
new_fish = pd.DataFrame(
[
{
"Species": "Bream",
"Weight": -1,
"Length1": 31.3,
"Length2": 34,
"Length3": 39.5,
"Height": 15.1285,
"Width": 5.5695,
}
]
)
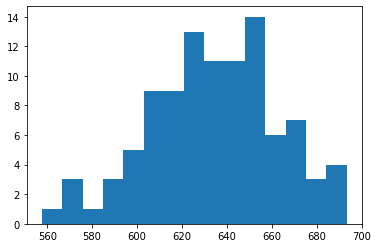
predictions = [e.predict(new_fish)[0] for e in estimators]
plt.hist(predictions, bins=15)
plt.savefig("twm1_hist.png", bbox_inches="tight")
Which gives us a nifty histogram of expected weight:
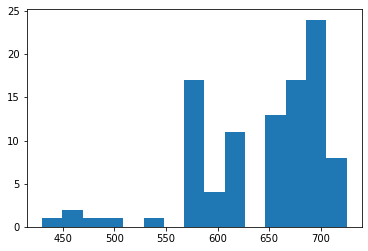
The cool thing about this approach, though, is that we can swap in any model
within the BaggingRegressor, and the rest of the code is unaffected. For
instance, here's the distribution of predictions when using decision trees:
Interesting idea, right? There's still a few more approaches I want to highlight in coming posts, but after that I'll be comparing them all to see which uncertainty estimation technique is best.
Comments? Questions? Concerns? Please tweet me @SamuelDataT or email me. Thanks!